Land Use Optimization
There is a set of urban blocks in a relatively small area.
The task is to to determine the optimal layout of functional zones.
Also it is necessary to identify the possible optimal composition of services for this area.
Optimizing land uses
Load blocks spatial data and visualize it.
[1]:
import geopandas as gpd

blocks_gdf = gpd.read_file('../blocks.geojson')[['geometry']]
blocks_gdf.geometry = blocks_gdf.buffer(-0.5)
blocks_gdf = gpd.GeoDataFrame(blocks_gdf.geometry.explode(True)).reset_index(drop=True)
blocks_gdf.plot().set_axis_off()
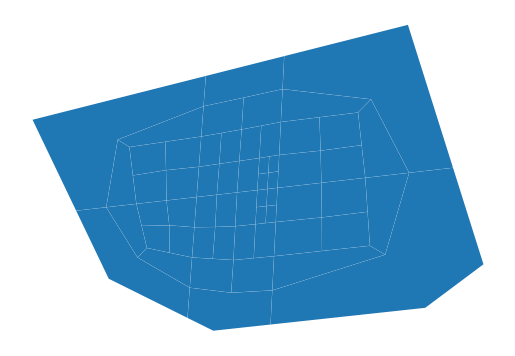
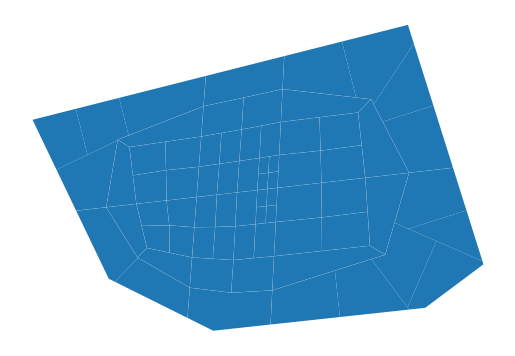
Initializing LandUseOptimizer instance. After initializing the loaded blocks will also be cut to fit possible aspect ratios.
[2]:
from blocksnet.preprocessing import LandUseOptimizer

luo = LandUseOptimizer(blocks_gdf)
luo.blocks.plot().set_axis_off()
Determine desired Land Use shares. The optimizer will try to fit these shares using MSE.
[3]:
from blocksnet import LandUse

lu_shares = {
  LandUse.RESIDENTIAL: 0.3,
  LandUse.BUSINESS: 0.2,
  LandUse.RECREATION: 0.2,
  LandUse.SPECIAL: 0.05,
  LandUse.INDUSTRIAL: 0.05,
  LandUse.AGRICULTURE: 0.1,
  LandUse.TRANSPORT: 0.1
}
Run LandUseOptimizer instance calculation method run(). It will return the following result: - best_X - best variables found in the simulated annealing process. - best_value - best fit value (the smaller it is, the closer optimization was to the desired shares). - Xs - list of X during all the iterations. - values - list of fit values during all the iterations.
The optimizer will try to fit desired shares according to rules: - Some land uses can’t be adjacent to others (like residential and industrial). - Some land uses have max ratio possible. For example, residential blocks will vary from 1:1 to 1:3.
[4]:
best_X, best_value, Xs, values = luo.run(lu_shares, rate=0.999, max_iter=100_000)
Value : 0.004: 20%|██ | 20255/100000 [02:11<08:38, 153.88it/s]
After the method found some result, we can visualize the flow of fit value to see how it changed.
[5]:
import matplotlib.pyplot as plt

plt.plot(values)
[5]:
[<matplotlib.lines.Line2D at 0x7f4a015973a0>]
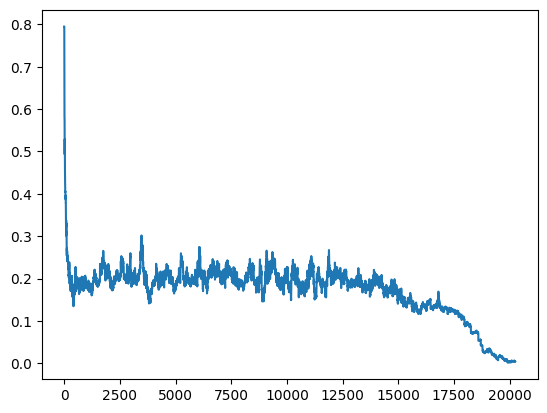
As we can see, it successfully found some kind of value close to 0.0. Otherwise we could adjust rate, temperature, or iterations of the optimizer.
[6]:
best_value
[6]:
0.001998457049778621
[7]:
luo.to_shares_dict(best_X)
[7]:
{<LandUse.RESIDENTIAL: 'residential'>: 0.26136152081823005,
 <LandUse.BUSINESS: 'business'>: 0.2084201382217867,
 <LandUse.RECREATION: 'recreation'>: 0.19428657048692446,
 <LandUse.SPECIAL: 'special'>: 0.055519879096642556,
 <LandUse.INDUSTRIAL: 'industrial'>: 0.06251407231282412,
 <LandUse.AGRICULTURE: 'agriculture'>: 0.10371699128343877,
 <LandUse.TRANSPORT: 'transport'>: 0.11418082778015352}
Let’s see how proportions of desired Land Uses changed.
[8]:
import pandas as pd

df = pd.DataFrame([{lu.value : share for lu,share in luo.to_shares_dict(X).items()} for X in Xs])
df.plot(kind='area', stacked=True, figsize=(10,10))
[8]:
<Axes: >
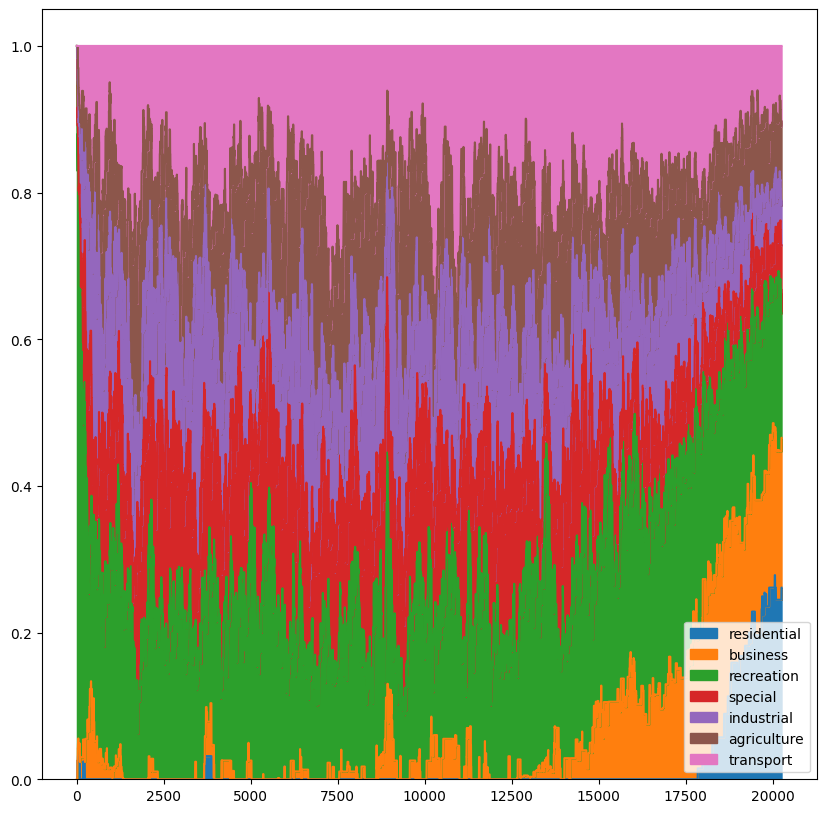
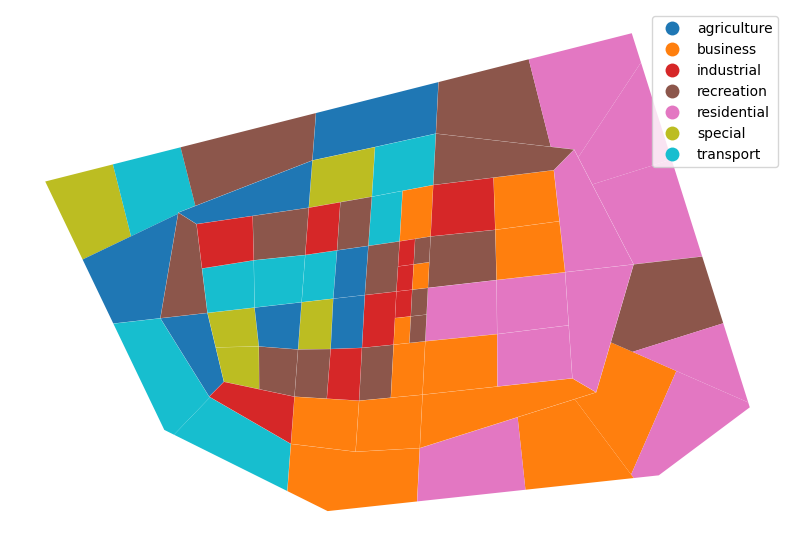
Finally, visualize the result. As we can see, residential blocks mostly locate at the periphery.
[9]:
luo.to_gdf(best_X).plot(column='land_use', legend=True, figsize=(10,10)).set_axis_off()
Services optimizer
We have to find optimal services composition for this land use set.
[10]:
import networkx as nx
from blocksnet import AccessibilityProcessor
from shapely import length, LineString, Point

SPEED = 10 * 1000 / 60

graph = luo.adjacency_graph.copy()
graph.graph['crs'] = luo.blocks.crs.to_epsg()
for node, data in graph.nodes(data=True):
  point = luo.blocks.loc[node,'geometry'].representative_point()
  data['geometry'] = point
  data['x'] = point.x
  data['y'] = point.y
for u, v, data in graph.edges(data=True):
  point_u = graph.nodes[u]['geometry']
  point_v = graph.nodes[v]['geometry']
  line_string = LineString([point_u, point_v])
  data['time_min'] = length(line_string)/SPEED

ap = AccessibilityProcessor(luo.blocks)
acc_mx = ap.get_accessibility_matrix(graph)
[11]:
from blocksnet import City

city = City(luo.to_gdf(best_X), acc_mx)
[15]:
from blocksnet.method.annealing_optimizer import AnnealingOptimizer, LU_FSIS, LU_GSIS

blocks_lu = {block.id : best_X[block.id] for block in city.blocks}
blocks_fsi = {b_id : LU_FSIS[lu][0] for b_id, lu in blocks_lu.items()}
blocks_gsi = {b_id : LU_GSIS[lu][0] for b_id, lu in blocks_lu.items()}
service_types = {service_type.name : 1/len(city.service_types) for service_type in city.service_types}

values = []

def on_iteration(i, X, indicators, value):
    values.append(value)

ao = AnnealingOptimizer(city_model=city, on_iteration=on_iteration, verbose=True)
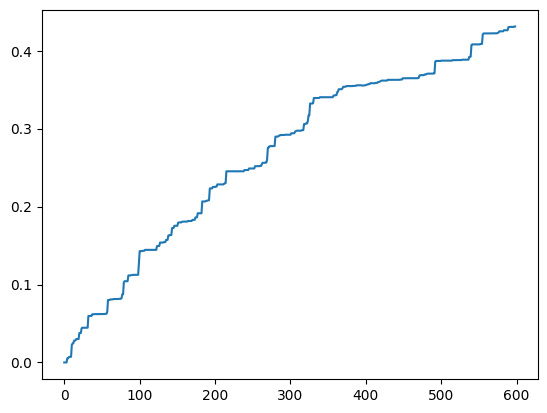
X, indicators, value, provisions = ao.calculate(blocks_lu, blocks_fsi, blocks_gsi, service_types, rate=0.95, max_iter=100_000)

plt.plot(values)
Value : 0.431: 1%| | 599/100000 [00:51<2:21:11, 11.73it/s]
[15]:
[<matplotlib.lines.Line2D at 0x7f49fbf4ee90>]
[17]:
provisions
[17]:
{'school': 0.3019165135206091,
 'kindergarten': 0.1721170395869191,
 'hospital': 1.0,
 'polyclinic': 0.5546623794212219,
 'pitch': 0.23357664233576642,
 'swimming_pool': 0.7822685788787483,
 'stadium': 1.0,
 'theatre': 1.0,
 'museum': 1.0,
 'cinema': 1.0,
 'mall': 1.0,
 'convenience': 0.03501196242049367,
 'supermarket': 0.011672970070504739,
 'cemetery': 0.0,
 'religion': 1.0,
 'market': 0.35456336178594877,
 'bowling_alley': 1.0,
 'university': 0.8038585209003215,
 'playground': 0.22448979591836735,
 'pharmacy': 0.17445917655268667,
 'fuel': 0.03177629488401652,
 'beach': 0.1639881928501148,
 'train_building': 1.0,
 'bank': 0.5238344683080147,
 'lawyer': 1.0,
 'cafe': 0.20553691275167785,
 'subway_entrance': 0.9333916939159093,
 'multifunctional_center': 0.014418496871701126,
 'hairdresser': 0.2502606882168926,
 'restaurant': 0.16853932584269662,
 'bar': 0.13003355704697986,
 'park': 0.0,
 'government': 1.0,
 'recruitment': 0.6420097697138869,
 'hotel': 0.0,
 'zoo': 1.0,
 'circus': 1.0,
 'post': 0.004503997297601621,
 'police': 0.7676348547717843,
 'dog_park': 0.2627722772277228,
 'hostel': 0.6952491309385863,
 'bakery': 0.651890482398957,
 'parking': 0.0013895450629463914,
 'guest_house': 0.05213764337851929,
 'reserve': 0.0,
 'sanatorium': 1.0,
 'embankment': 0.0,
 'machine-building_plant': 1.0,
 'brewery': 0.6016597510373444,
 'woodworking_plant': 0.0,
 'oil_refinery': 0.0,
 'plant_of_building_materials': 0.20855057351407716,
 'wastewater_plant': 0.02247925777577962,
 'water_works': 0.0,
 'substation': 0.010144642974016625,
 'train_station': 0.1361969617600838,
 'bus_station': 0.08192129953787985,
 'bus_stop': 0.005238344683080147,
 'pier': 0.3112033195020747,
 'animal_shelter': 0.0,
 'military_kom': 0.9803921568627451,
 'prison': 0.0,
 'landfill': 1.0,
 'plant_nursery': 0.0,
 'greenhouse_complex': 1.0,
 'warehouse': 0.0}
This set of service units if the first approximation of possible composition.
[16]:
ao.to_bricks_df(X)
[16]:
| block_id | service_type | is_integrated | area | capacity | count | |
|---|---|---|---|---|---|---|
| 89 | 1 | train_station | False | 1300.0 | 100 | 1 |
| 1259 | 19 | bus_station | False | 320.0 | 200 | 1 |
| 1271 | 19 | hostel | True | 100.0 | 20 | 1 |
| 1283 | 19 | sanatorium | True | 4000.0 | 1000 | 1 |
| 1317 | 19 | substation | False | 35000.0 | 70 | 1 |
| ... | ... | ... | ... | ... | ... | ... |
| 8737 | 82 | pharmacy | False | 85.0 | 70 | 1 |
| 8769 | 82 | stadium | False | 35000.0 | 21000 | 1 |
| 8792 | 82 | restaurant | True | 800.0 | 200 | 1 |
| 8819 | 82 | train_station | False | 1300.0 | 100 | 1 |
| 8934 | 83 | beach | False | 3100.0 | 1000 | 1 |
218 rows × 6 columns