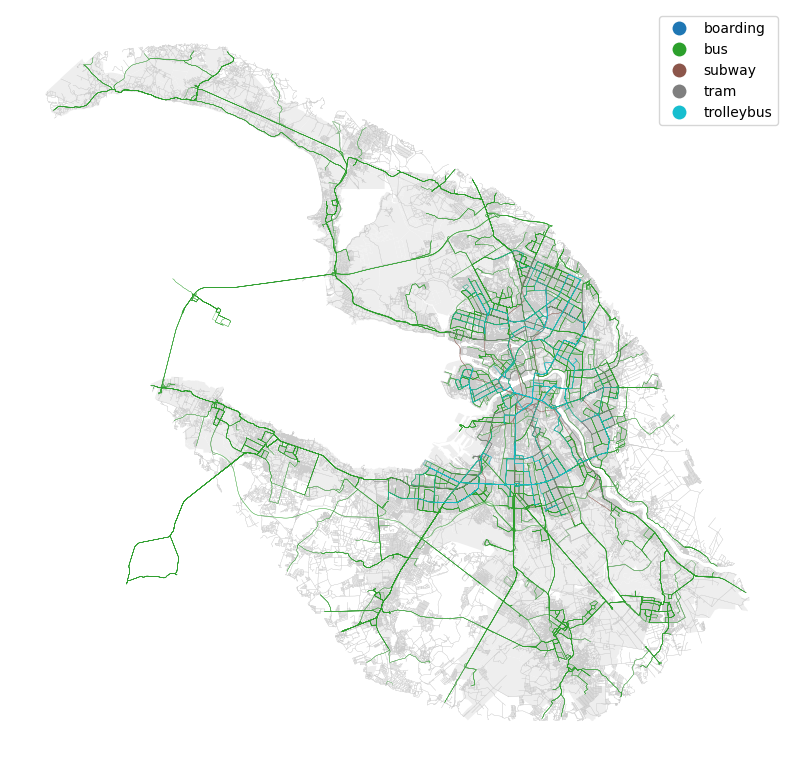
Generating intermodal graph and calculating accessibility matrix
BlocksNet uses IduEdu network library to generate city intermodal graph and calculate the accessibility matrix.
[1]:
import os
import geopandas as gpd

data_path = "./data"
Read blocks and initialize processor instance
[2]:
from blocksnet import AccessibilityProcessor

blocks = gpd.read_parquet(os.path.join(data_path, 'blocks.parquet'))
ap = AccessibilityProcessor(blocks)
Generate an intermodal city graph
[3]:
graph = ap.get_intermodal_graph()
/home/vasilstar/masterplanning/.venv/lib/python3.10/site-packages/shapely/linear.py:90: RuntimeWarning: invalid value encountered in line_locate_point
  return lib.line_locate_point(line, other)
[4]:
ap.plot(blocks, graph)

Calculate the accessibility matrix
[5]:
acc_mx = ap.get_accessibility_matrix(graph)
acc_mx.head()
[5]:
| 0 | 1 | 2 | 3 | 4 | 5 | 6 | 7 | 8 | 9 | ... | 16310 | 16311 | 16312 | 16313 | 16314 | 16315 | 16316 | 16317 | 16318 | 16319 | |
|---|---|---|---|---|---|---|---|---|---|---|---|---|---|---|---|---|---|---|---|---|---|
| 0 | 0.000000 | 18.718750 | 9.234375 | 17.21875 | 30.296875 | 27.390625 | 30.671875 | 23.281250 | 78.6875 | 81.2500 | ... | 76.5625 | 102.5625 | 97.5000 | 132.250 | 130.8750 | 142.125 | 247.625 | 228.625 | 247.625 | 124.6250 |
| 1 | 17.859375 | 0.000000 | 19.015625 | 7.65625 | 20.281250 | 25.250000 | 25.234375 | 15.765625 | 76.8750 | 79.4375 | ... | 74.6875 | 100.7500 | 95.6875 | 130.500 | 129.0000 | 140.250 | 245.875 | 226.875 | 245.875 | 112.5000 |
| 2 | 9.234375 | 20.796875 | 0.000000 | 20.21875 | 27.968750 | 25.062500 | 28.343750 | 20.953125 | 71.8750 | 74.4375 | ... | 69.7500 | 95.8125 | 90.6875 | 125.500 | 124.0625 | 135.375 | 240.875 | 221.875 | 240.875 | 124.6250 |
| 3 | 15.937500 | 7.449219 | 18.421875 | 0.00000 | 21.109375 | 24.984375 | 27.781250 | 16.593750 | 76.3125 | 78.8125 | ... | 74.1250 | 100.1875 | 95.0625 | 129.875 | 128.5000 | 139.750 | 245.250 | 226.250 | 245.250 | 113.3750 |
| 4 | 31.906250 | 19.765625 | 31.734375 | 21.28125 | 0.000000 | 21.781250 | 23.125000 | 15.429688 | 89.5625 | 92.1250 | ... | 87.4375 | 113.5000 | 108.3750 | 143.125 | 141.7500 | 153.000 | 258.500 | 239.500 | 258.500 | 108.3125 |
5 rows × 16320 columns
[6]:
acc_mx.to_pickle(os.path.join(data_path, 'acc_mx.pickle'))