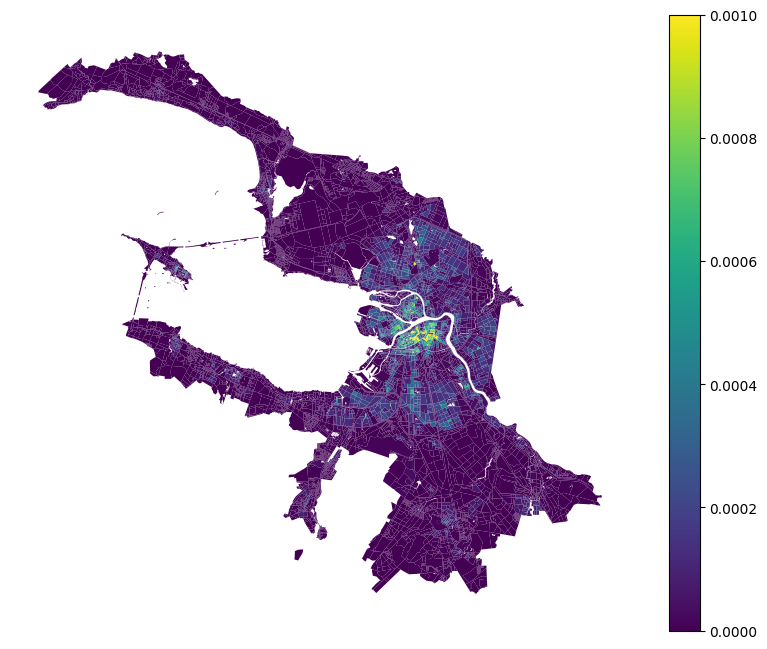
Services density
Services density indicates the amount of services per square meter.
[1]:
import pandas as pd

blocks_gdf = pd.read_pickle('./../../data/saint_petersburg/blocks.pickle')
[3]:
from blocksnet.analysis.services import services_density

density_df = services_density(blocks_gdf)
density_df.head()
[3]:
| site_area | count_school | count_kindergarten | count_hospital | count_polyclinic | count_pitch | count_swimming_pool | count_theatre | count_museum | count_cinema | ... | count_bus_stop | count_pier | count_animal_shelter | count_prison | count_landfill | count_plant_nursery | count_greenhouse_complex | count_warehouse | count | density | |
|---|---|---|---|---|---|---|---|---|---|---|---|---|---|---|---|---|---|---|---|---|---|
| 0 | 0.032316 | 0 | 0 | 0 | 0 | 0 | 0 | 0 | 0 | 0 | ... | 0 | 0 | 0 | 0 | 0 | 0 | 0 | 0 | 0 | 0.000000 |
| 1 | 137101.088247 | 0 | 0 | 0 | 0 | 0 | 0 | 0 | 0 | 0 | ... | 0 | 0 | 0 | 0 | 0 | 0 | 0 | 0 | 2 | 0.000015 |
| 2 | 95239.084434 | 0 | 0 | 0 | 0 | 0 | 0 | 0 | 0 | 0 | ... | 0 | 0 | 0 | 0 | 0 | 0 | 0 | 0 | 0 | 0.000000 |
| 3 | 125919.330984 | 0 | 0 | 0 | 0 | 0 | 0 | 0 | 0 | 0 | ... | 0 | 0 | 0 | 0 | 0 | 0 | 0 | 0 | 0 | 0.000000 |
| 4 | 169860.164494 | 1 | 0 | 0 | 0 | 2 | 0 | 0 | 0 | 0 | ... | 0 | 0 | 0 | 0 | 0 | 1 | 0 | 0 | 4 | 0.000024 |
5 rows × 63 columns
[6]:
blocks_gdf[['geometry']].join(density_df).plot('density', figsize=(10,8), legend=True, vmax=0.001).set_axis_off()