Density indicators
[1]:
import pandas as pd

blocks_gdf = pd.read_pickle('./../../data/saint_petersburg/blocks.pickle')
[2]:
from blocksnet.analysis.indicators import calculate_density_indicators

density_df = calculate_density_indicators(blocks_gdf)
density_df.head()
[2]:
| site_area | footprint_area | build_floor_area | living_area | non_living_area | fsi | gsi | mxi | l | osr | share_living | share_non_living | |
|---|---|---|---|---|---|---|---|---|---|---|---|---|
| 0 | 0.032316 | 0.000000 | 0.000000 | 0.000000 | 0.000000 | 0.000000 | 0.000000 | NaN | NaN | inf | NaN | NaN |
| 1 | 137101.088247 | 69.018103 | 69.018103 | 0.000000 | 69.018103 | 0.000503 | 0.000503 | 0.000000 | 1.000000 | 1985.451134 | 0.000000 | 1.000000 |
| 2 | 95239.084434 | 5853.863274 | 6106.759644 | 4197.188633 | 1909.571011 | 0.064120 | 0.061465 | 0.687302 | 1.043202 | 14.637095 | 0.716995 | 0.326207 |
| 3 | 125919.330984 | 4214.828165 | 4375.483259 | 3033.795607 | 1341.687653 | 0.034748 | 0.033472 | 0.693362 | 1.038117 | 27.815100 | 0.719791 | 0.318326 |
| 4 | 169860.164494 | 13392.846325 | 31242.324144 | 20860.965881 | 10381.358263 | 0.183930 | 0.078846 | 0.667715 | 2.332762 | 5.008184 | 1.557620 | 0.775142 |
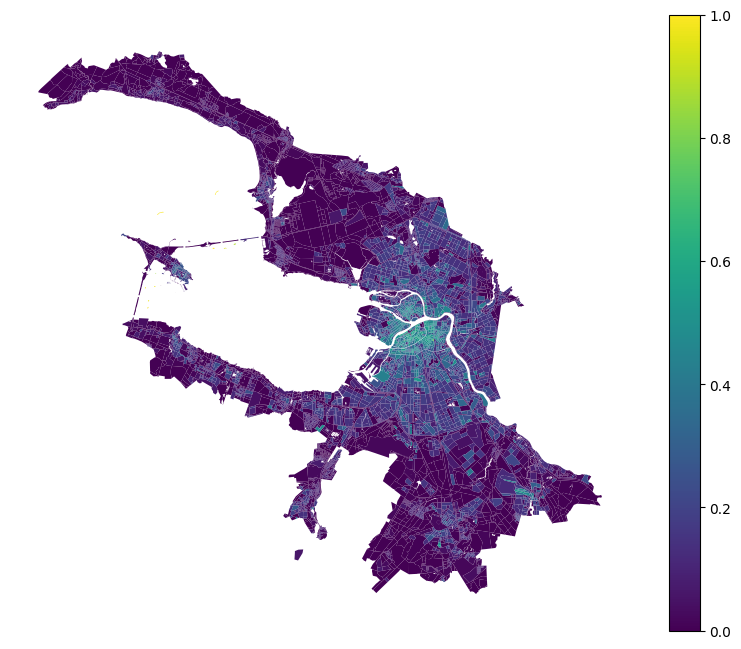
[3]:
blocks_gdf[['geometry']].join(density_df).plot('gsi', legend=True, figsize=(10,8)).set_axis_off()